
Prelude 2025 SMS Pumping Fraud Report: What 205 Million Authentication Requests Revealed
A data-driven look at how SMS pumping evolved into a multi-million dollar fraud ecosystem

Nam Hing Chau
Marketing Manager
Summary
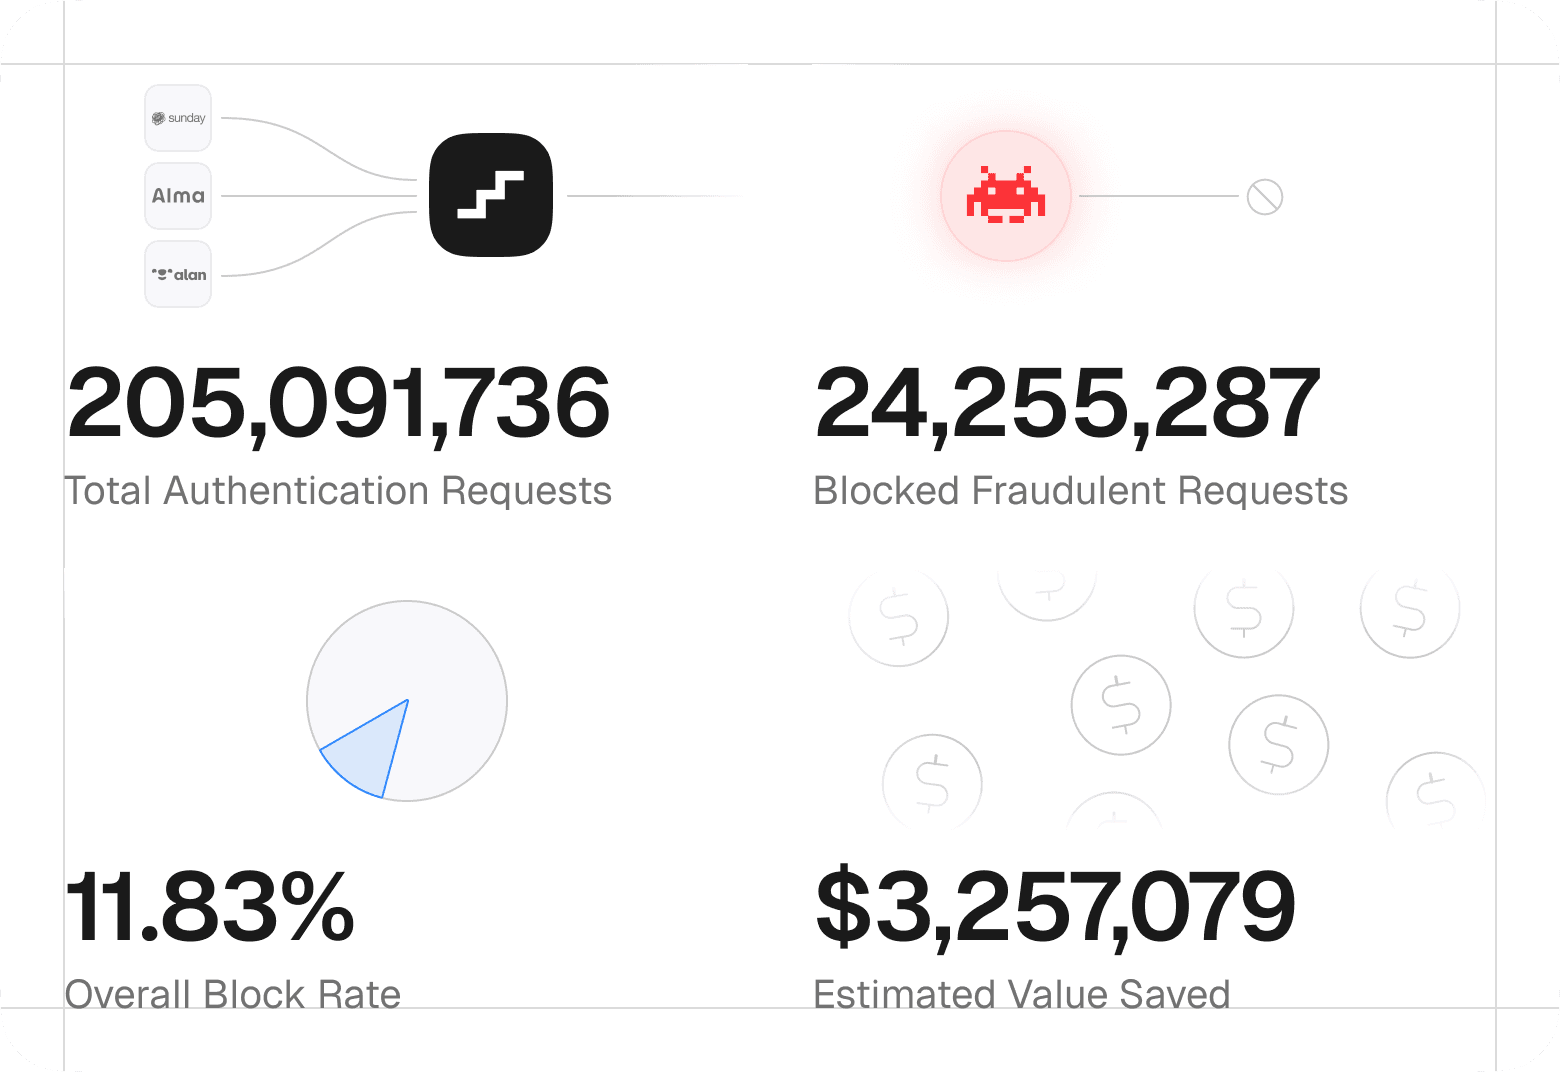
Prelude's analysis of 205 million authentication requests found 11.83% were fraudulent — 24.3 million blocked requests and $3.26M in prevented SMS costs. The report maps how SMS pumping operations actually work: how attackers select targets, exploit specific countries and carriers, and why most companies fail to notice the abuse for years.
SMS based authentication remains a foundational component of onboarding, login, and account recovery flows across consumer applications.
At the same time, it has quietly become one of the most abused attack surfaces for fraud.
In 2025, SMS pumping, also referred to as Artificially Inflated Traffic or IRSF related abuse, continued to scale globally. Attackers systematically exploited SMS verification endpoints to generate fraudulent traffic, monetizing termination fees through premium routes and revenue sharing arrangements with carriers.
At Prelude, we analyzed a representative sample of authentication traffic processed across our verification platform throughout 2025. The results were striking:
205 million+ authentication requests analyzed
24.3 million fraudulent requests blocked
11.83% of all traffic identified as fraud
$3.26 million in estimated SMS costs prevented
More importantly, the data revealed how modern SMS pumping operations actually work: how attackers choose targets, which countries and carriers they exploit, what infrastructure they rely on, and why so many companies failed to notice the abuse for years.
Key Takeaways
SMS pumping remains one of the most financially damaging yet under-detected fraud vectors
A small number of countries and carriers account for a disproportionate share of abuse
Residential proxies became the dominant attack infrastructure in 2025
Many incidents initially went unnoticed due to inflated growth and DAU metrics
Why SMS Pumping Went Undetected for So Long
Unlike account takeovers or payment fraud, SMS pumping rarely produces immediate user- facing failures. Authentication flows continue to function, messages are delivered, and systems remain stable. From the outside, nothing appears broken.
That invisibility is exactly what made SMS pumping so effective.
Instead of triggering alarms, SMS pumping distorted growth signals. For years, automated verification traffic was counted as legitimate activity, inflating metrics that were traditionally associated with success.
In particular, Daily Active Users (DAU) proved to be a misleading indicator. Fraudulent verification attempts registered as user activity, making abuse indistinguishable from organic growth. What appeared as momentum was often volume without intent.
As DAU increased, so did confidence. Product teams interpreted the trend as adoption, finance teams absorbed rising SMS costs as variable growth expenses, and security teams focused on threats with visible user impact. Higher volume was rarely questioned.
SMS pumping thrived in this environment. It exploited metric driven incentives, siloed ownership, and the assumption that activity equaled value. By the time teams connected rising costs to fraudulent behavior, attackers had often already extracted significant revenue.
Inside the 2025 Dataset
This report analyzes authentication traffic processed between January 1 and December 31, 2025 across a representative sample of Prelude customers.
The dataset includes:
205+ million authentication requests analyzed
Traffic spanning 200+ destination countries
Coverage across multiple consumer-facing verticals
Real-time fraud detection using machine learning, telecom intelligence, and behavioral signals
While the sample does not represent all SMS traffic processed by Prelude, it is statistically meaningful in scale, geography, and customer diversity.
Value saved is estimated by multiplying blocked requests by average country-level SMS termination costs. Actual customer savings vary depending on individual pricing agreements
More than 1 in 10 authentication attempts in the analyzed sample was fraudulent.
That number alone highlights how deeply embedded SMS pumping has become inside modern authentication systems.
The Rise of Machine Learning
One of the clearest findings from 2025 was that static fraud rules are no longer enough.
Attackers adapted continuously:
Rotating IPs
Cycling residential proxies
Distributing requests geographically
Mimicking real-user timing patterns
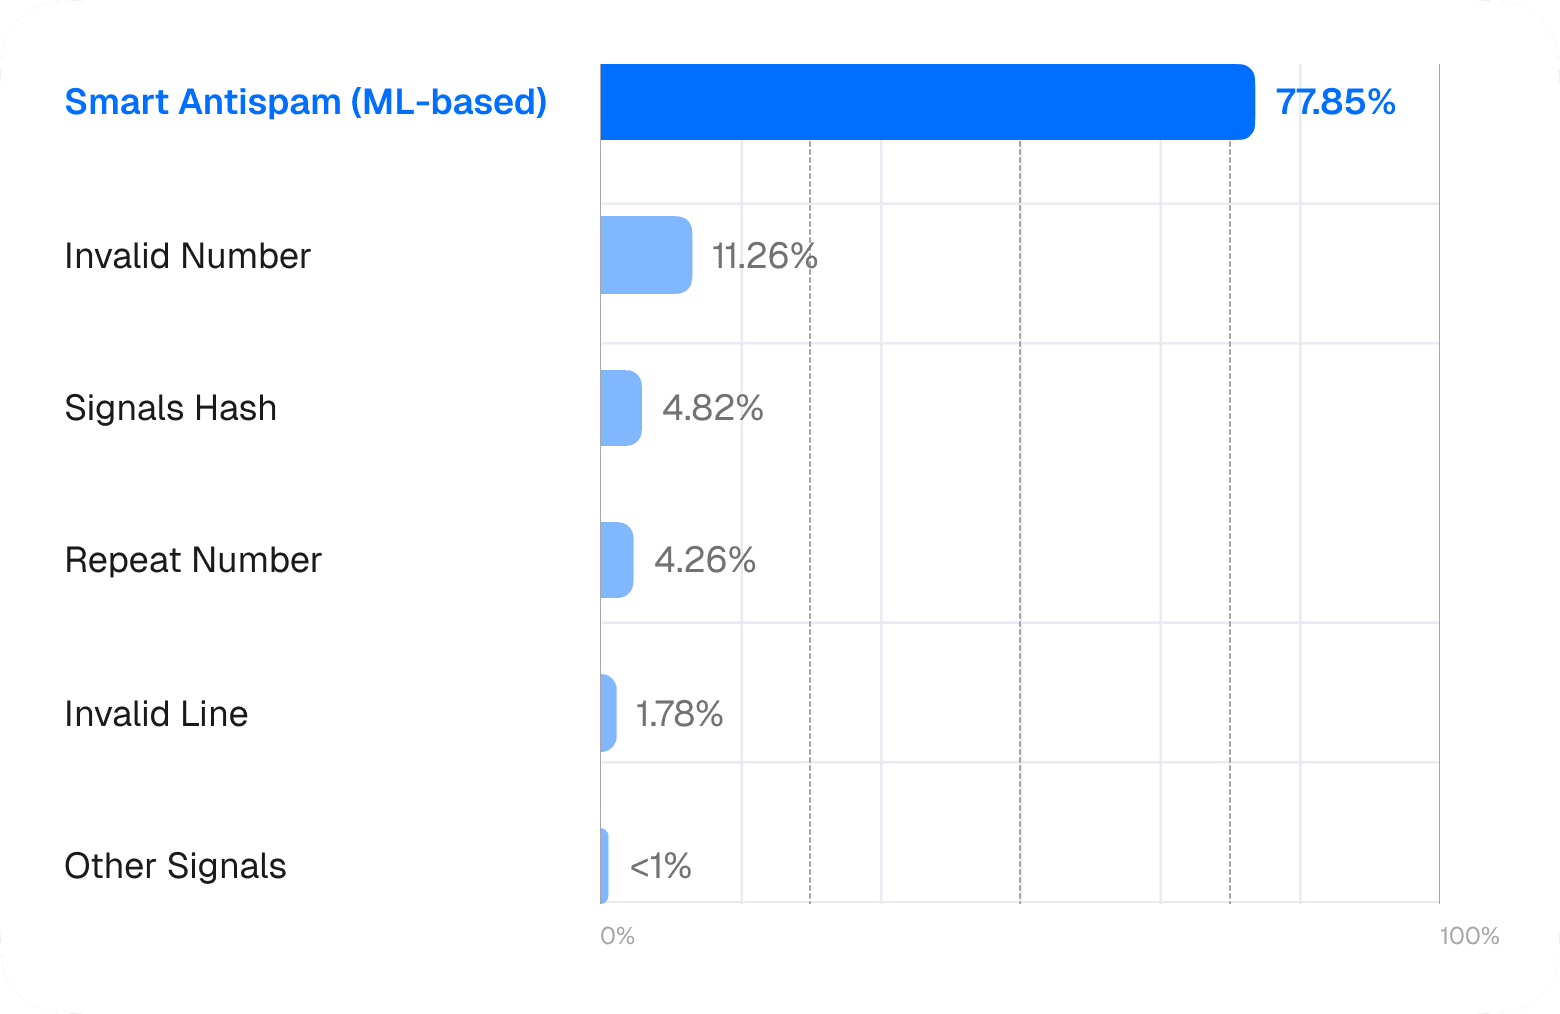
Prelude combines multiple detection layers to identify SMS pumping attempts in real time.
Detection Method | Blocked Requests | % of Total |
Smart Antispam (ML-based) | 18,881,979 | 77.85% |
Invalid Number | 2,730,581 | 11.26% |
Signals Hash | 1,169,589 | 4.82% |
Repeat Number | 1,032,333 | 4.26% |
Invalid Line | 431,157 | 1.78% |
Other Signals | <1% |
Machine-learning-based detection accounted for nearly four out of five blocked requests-nearly 78% of all blocked fraud- underscoring the limits of static rules when facing adaptive attackers.
The takeaway is clear: modern SMS pumping campaigns behave more like adaptive botnets than simple spam attacks.
A Small Number of Countries Drove Most Fraud
Fraud distribution was heavily concentrated.
A relatively small set of countries, carriers, and telecom routes accounted for a disproportionate amount of abuse.
Top 20 Countries by Blocked Requests
Rank | Country | Blocked Requests | % of Total Blocked | Block Rate | Estimated Value Saved |
1 | France (FR) | 3,198,238 | 13.19% | 10.87% | $122,141 |
2 | Indonesia (ID) | 1,248,779 | 5.15% | 39.35% | $325,060 |
3 | Madagascar (MG) | 1,073,633 | 4.43% | 95.20% | $287,881 |
4 | Malaysia (MY) | 919,087 | 3.79% | 45.39% | $127,989 |
5 | Nigeria (NG) | 894,340 | 3.69% | 71.43% | $185,724 |
6 | Bulgaria (BG) | 823,250 | 3.39% | 63.38% | $76,285 |
7 | Philippines (PH) | 593,910 | 2.45% | 11.72% | $81,056 |
8 | Russia (RU) | 586,026 | 2.42% | 51.71% | $174,407 |
9 | United Kingdom (GB) | 585,614 | 2.41% | 7.85% | $18,746 |
10 | Tajikistan (TJ) | 548,248 | 2.26% | 89.44% | $141,804 |
11 | Bangladesh (BD) | 480,433 | 1.98% | 74.80% | $109,808 |
12 | Germany (DE) | 469,627 | 1.94% | 6.75% | $28,705 |
13 | Ukraine (UA) | 453,776 | 1.87% | 31.14% | $58,786 |
14 | Japan (JP) | 440,968 | 1.82% | 5.74% | $27,789 |
15 | Morocco (MA) | 417,667 | 1.72% | 44.22% | $53,796 |
16 | Mexico (MX) | 417,430 | 1.72% | 6.39% | $31,472 |
17 | United States (US) | 391,938 | 1.62% | 0.84% | $4,959 |
18 | Romania (RO) | 385,899 | 1.59% | 19.45% | $24,567 |
19 | Brazil (BR) | 367,145 | 1.51% | 10.50% | $29,372 |
Some countries showed extraordinarily high fraud concentration.
Countries with the highest fraud rates
Countries with block rates above 50% represent environments where authentication traffic is overwhelmingly fraudulent.
Country | Block Rate | Notes |
Madagascar (MG) | 95.20% | Telma carrier heavily targeted |
Tajikistan (TJ) | 89.44% | Tcell (436-02) primary target |
Angola (AO) | 79.65% | Movicel targeted |
Mongolia (MN) | 76.53% | Emerging fraud destination |
Bangladesh (BD) | 74.80% | Multiple carriers affected |
Afghanistan (AF) | 74.65% | MTN Afghanistan targeted |
Myanmar (MM) | 74.80% | Telenor/MPT networks |
Nigeria (NG) | 71.43% | MTN Nigeria primary target |
Iran (IR) | 66.10% | MTN Irancell affected |
Bulgaria (BG) | 63.38% | A1 Bulgaria, Vivacom targeted |
In these regions, SMS pumping is not incidental, it is the dominant use case for authentication endpoints.
Carrier-Level Concentration
Attackers did not distribute traffic randomly.
They repeatedly targeted:
Specific carriers
Specific MCC-MNC combinations
Specific MVNO ranges
Telecom networks with favorable revenue-sharing arrangements
The top targeted carrier routes included:
MCC-MNC | Country | Carrier | Blocked Requests | % of Total |
646-04 | Madagascar | Telma | 1,068,270 | 4.40% |
510-11 | Indonesia | XL Axiata | 1,041,030 | 4.29% |
621-60 | Nigeria | MTN Nigeria | 762,379 | 3.14% |
208-10 | France | SFR | 702,258 | 2.90% |
284-01 | Bulgaria | A1 Bulgaria | 522,768 | 2.16% |
515-02 | Philippines | Globe Telecom | 483,723 | 1.99% |
208-01 | France | Orange France | 472,248 | 1.95% |
208-20 | France | Bouygues Telecom | 386,810 | 1.59% |
502-16 | Malaysia | DiGi | 380,043 | 1.57% |
502-19 | Malaysia | Celcom | 356,925 | 1.47% |
604-02 | Morocco | Méditel/Orange | 345,632 | 1.42% |
631-04 | Angola | Movicel | 307,077 | 1.27% |
436-02 | Tajikistan | Tcell | 289,226 | 1.19% |
226-01 | Romania | Vodafone Romania | 240,594 | 0.99% |
293-41 | Slovenia | A1 Slovenia | 199,799 | 0.82% |
This concentration matters because attackers optimize for profitability, not scale alone.
Once a telecom route becomes profitable, it tends to remain under sustained attack until defenses improve or economics change.
Attack Patterns and Case Studies
Across countries and incidents, three behavioral patterns consistently appeared.
Sustained High-Volume Campaigns
Some attacks prioritized throughput over stealth and operated continuously for days.
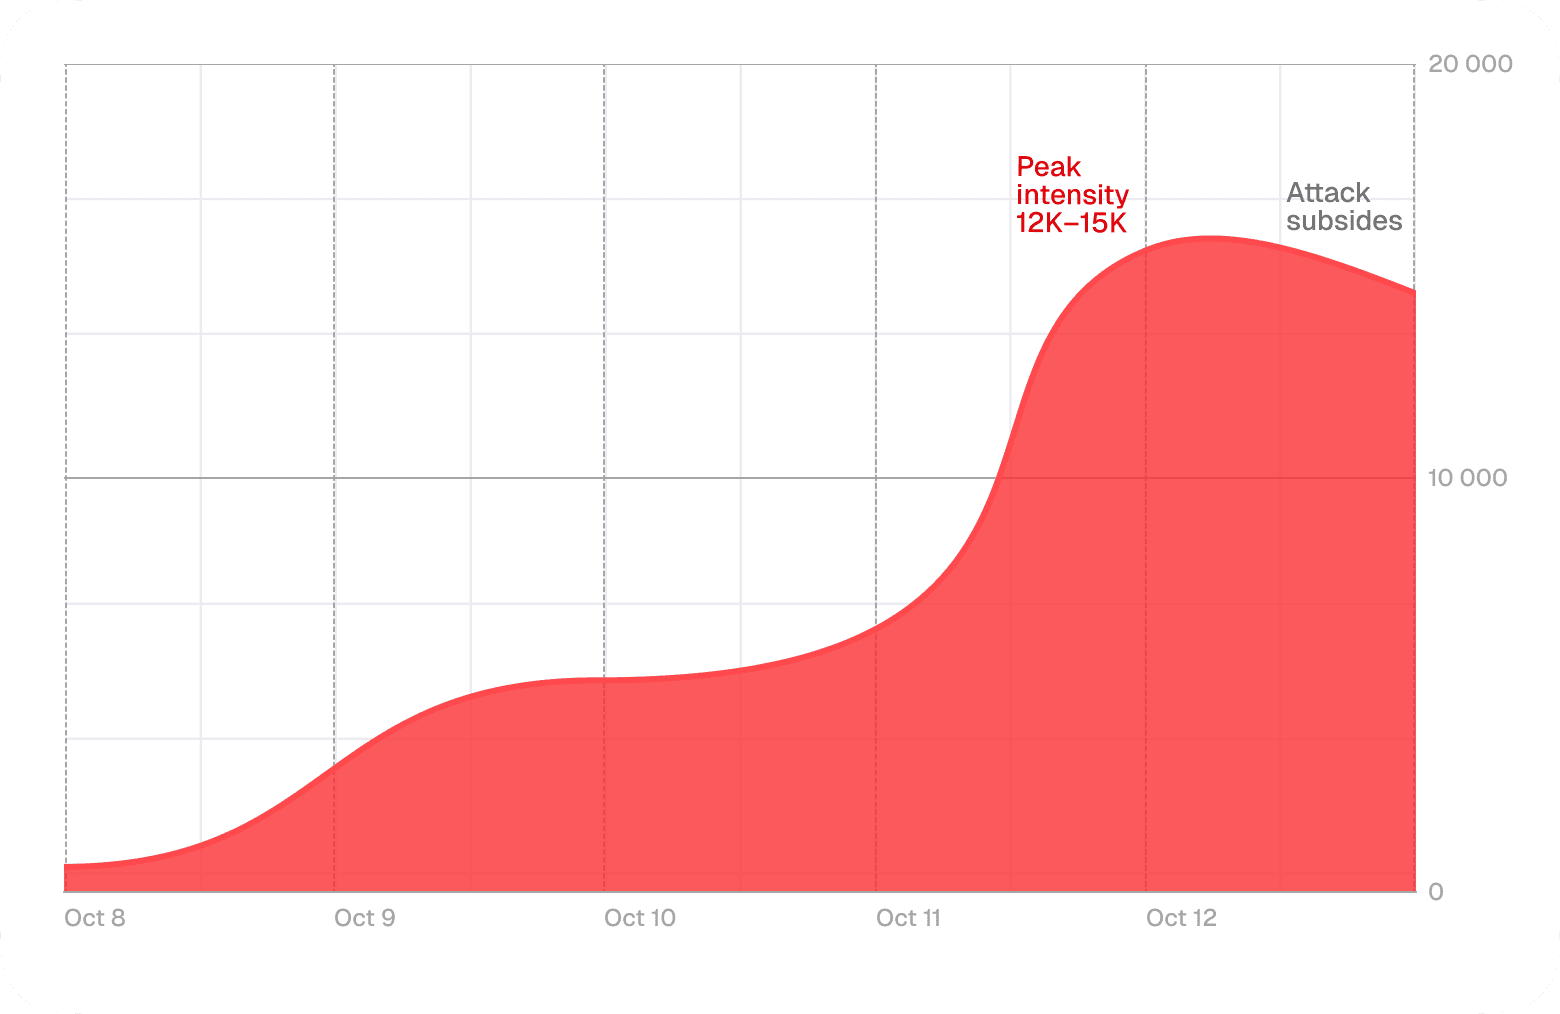
Example: France (October 2025)
The largest single attack of 2025 targeted France in October, generating 1.86 million blocked requests in a single month (41.31% block rate).
Attack Timeline:
October 8, 22:00 UTC: Attack begins, 585 requests/hour
October 9, 08:00-12:00: Escalation to 5,000+ requests/hour
October 10-11: Sustained attack at 5,000+ requests/hour (24/7)
October 12, 11:00-19:00: Peak intensity at 12,000-15,000 requests/hour
October 14, 16:00: Attack subsides
The attack:
Targeted all three major French carriers
Focused on specific MVNO prefixes
Operated continuously for several days
Reached peaks of 12,000–15,000 requests per hour
The pattern strongly suggests a fully automated operation optimized for sustained throughput rather than stealth.
Sudden spike attacks
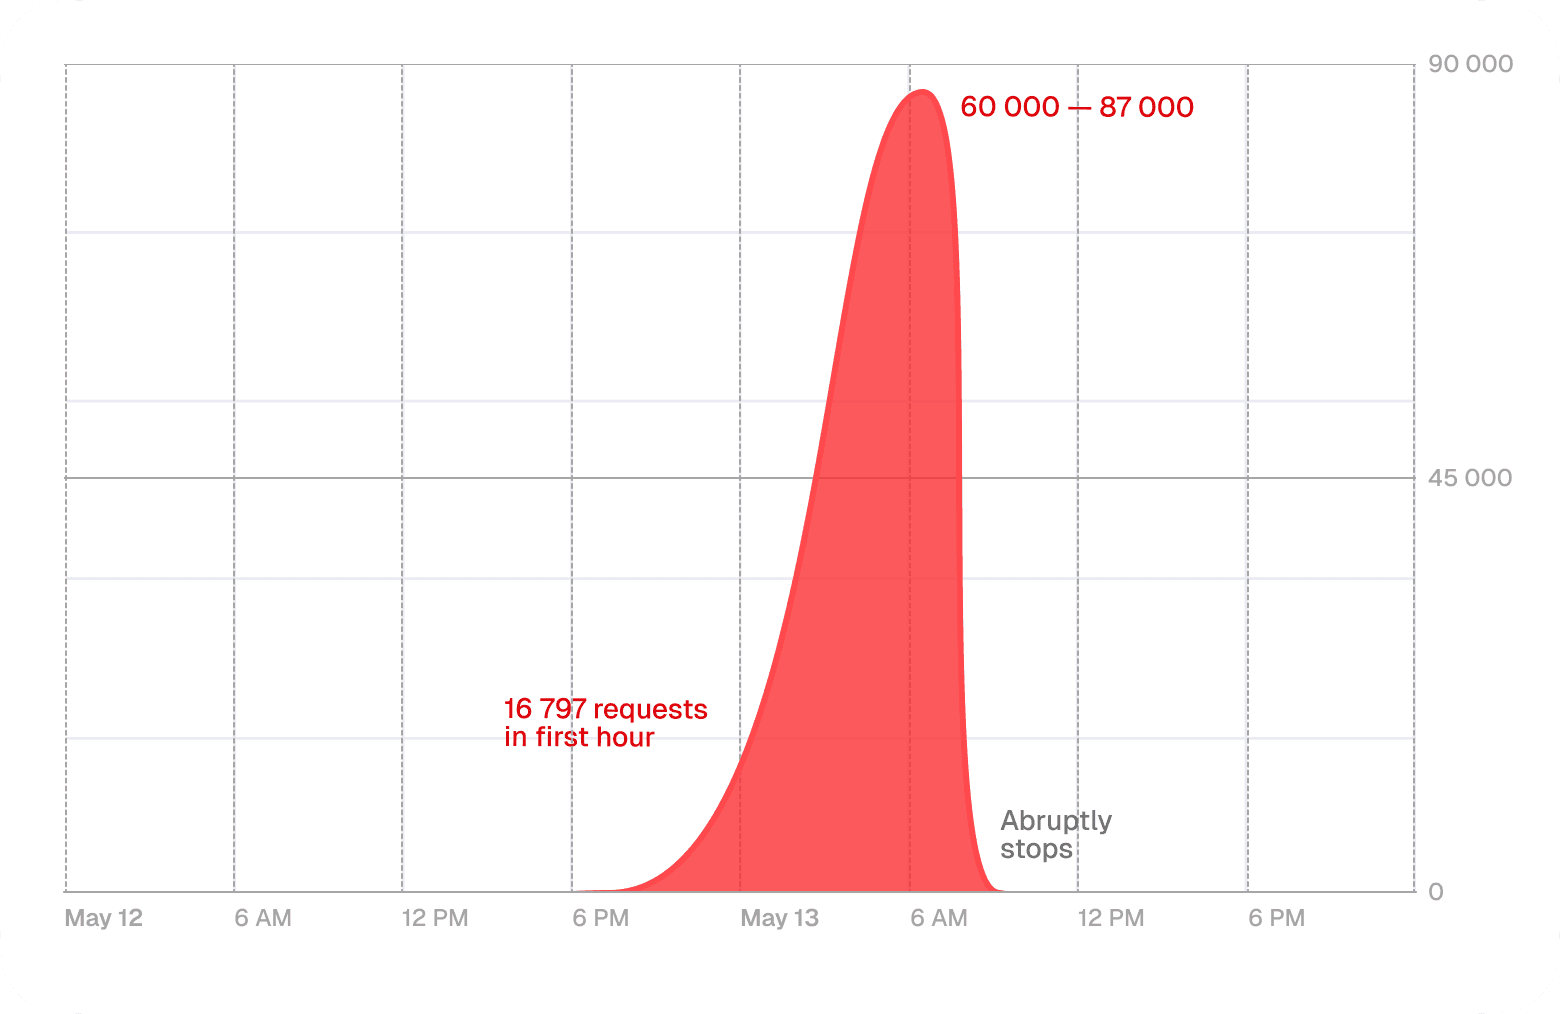
Example: Nigeria (May 2025)
A massive SMS pumping attack hit Nigeria in May 2025 with 763,212 blocked requests.
Attack Timeline:
May 12, 21:00 UTC: Attack begins suddenly (16,797 requests in first hour)
May 12-13: Sustained 60,000-87,000 requests/hour
May 13, 08:00: Attack abruptly stops
Nigeria experienced a highly concentrated attack lasting approximately 12 hours.
During this window:
96.7% of Nigerian traffic was fraudulent
Traffic was almost exclusively directed at a single carrier
Hourly volumes reached up to 87,000 requests
This reflects a “hit-and-run” strategy designed to extract value before defenses adapt.
3. Low-and-slow fraud
Some attacks deliberately avoided large spikes.
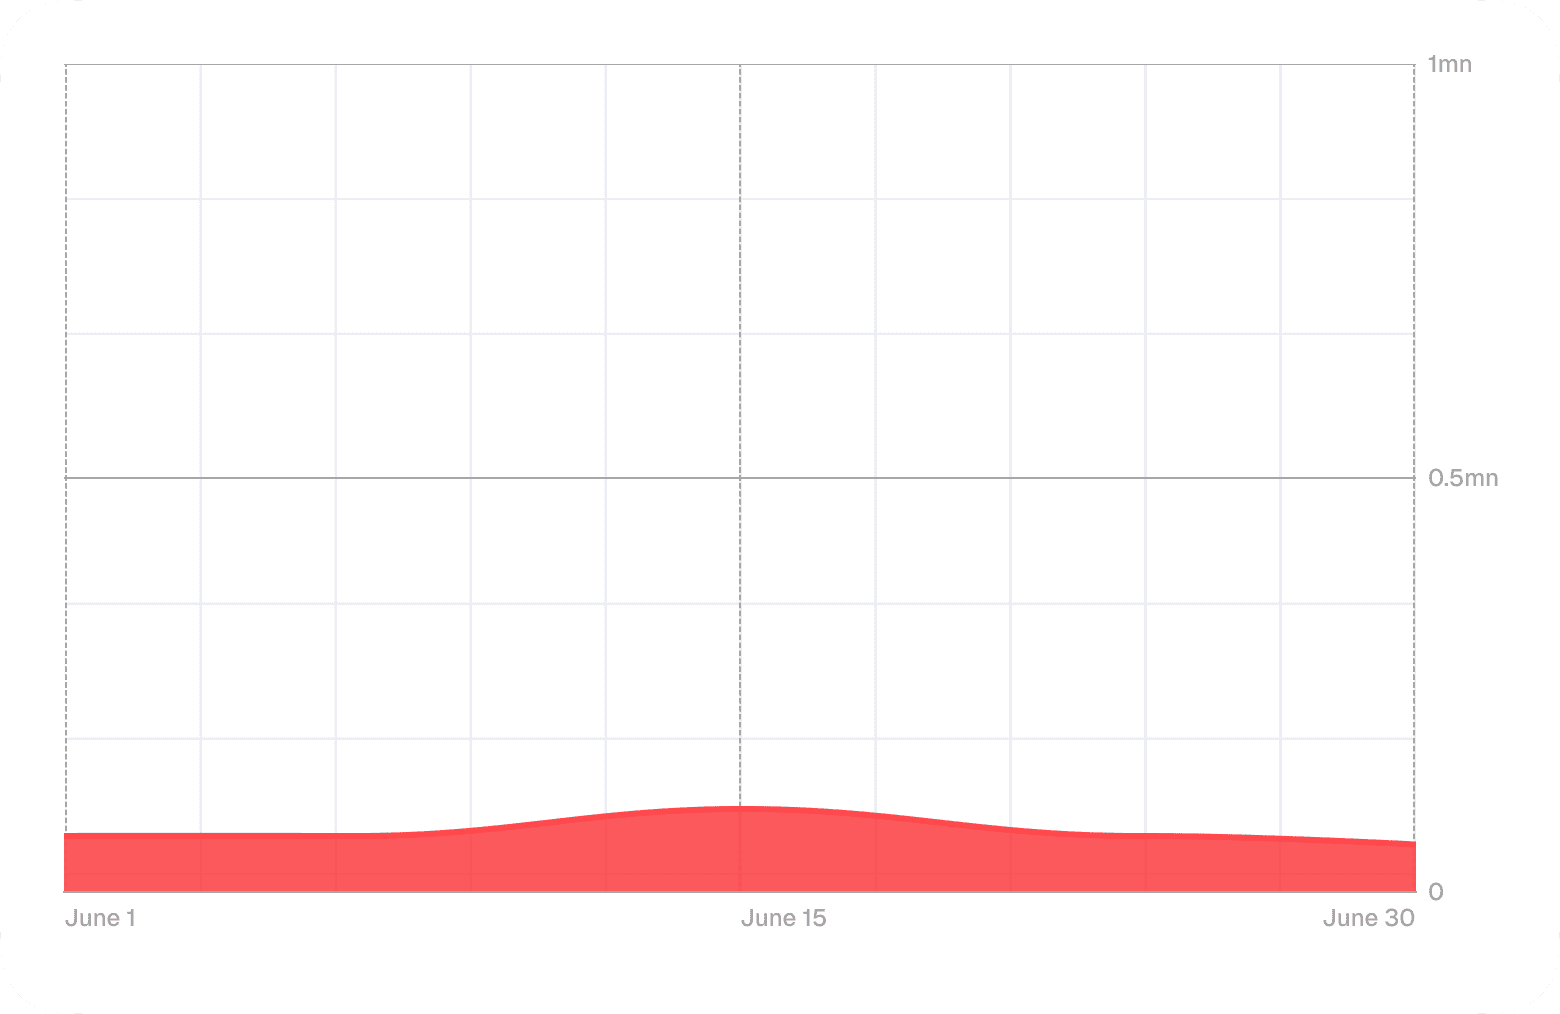
Example: Madagascar (June 2025)
Madagascar experienced sustained fraud throughout June with 996,704 blocked requests (98.64% block rate).
Madagascar showed a different pattern: lower hourly volumes sustained over an entire month.
With a block rate exceeding 98%, this attack likely relied on stable revenue-sharing arrangements rather than short-term spikes.
In other words, this pattern strongly suggests long-term telecom monetization arrangements rather than short-lived opportunistic abuse.
Fraud Timing Patterns
Fraud activity was not random. There were certain days and hours that consistently displayed elevated attack activity.
Fraud by Day of Week
Monday: 3,639,095 (15.0%)
Tuesday: 4,424,687 (18.2%) <- Peak day
Wednesday: 2,990,573 (12.3%)
Thursday: 3,663,542 (15.1%)
Friday: 3,576,918 (14.7%)
Saturday: 3,206,498 (13.2%)
Sunday: 2,753,422 (11.4%) <- Lowest
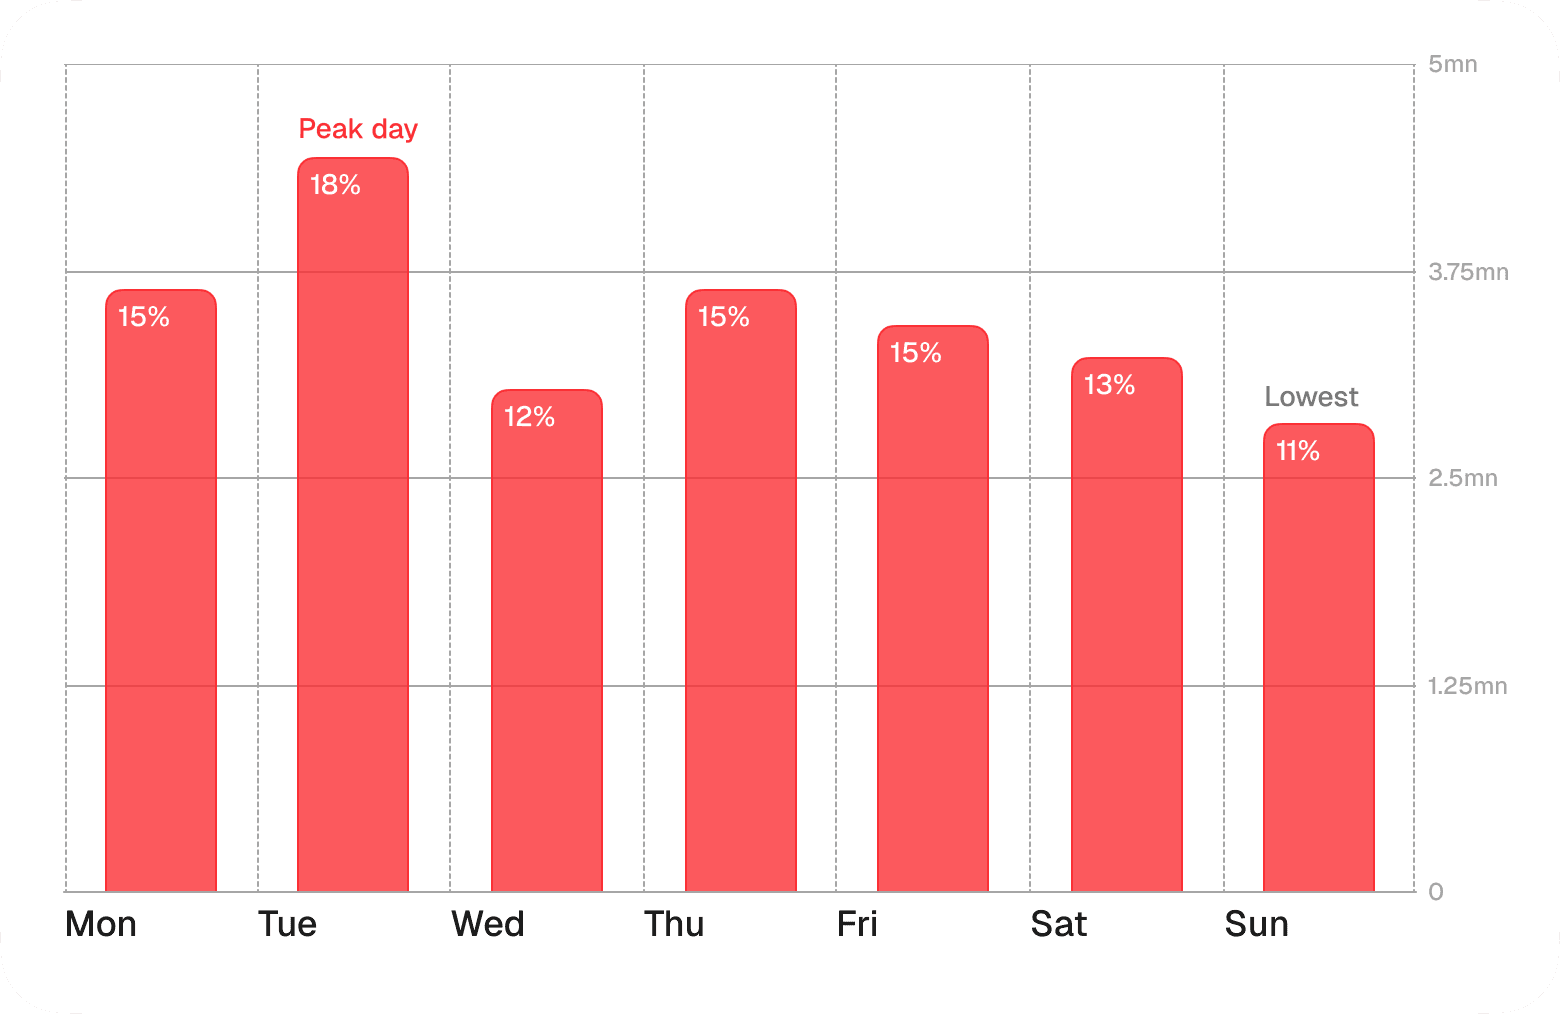
As seen in the image above, Tuesdays consistently produced the highest fraud volumes.
One likely explanation is operational timing, which means attackers may intentionally target periods where monitoring coverage and alert responsiveness are weaker.
Hour of Day Distribution (UTC)
Peak Hours: 06:00-07:00 UTC (1.49M blocked)
03:00-04:00 UTC (1.19M blocked)
22:00-23:00 UTC (1.15M blocked)
Low Hours: 21:00-22:00 UTC (822K blocked)
18:00-19:00 UTC (891K blocked)
The highest fraud volumes occurred at these times:
06:00–07:00 UTC
03:00–04:00 UTC
22:00–23:00 UTC
We can infer, then, that attacks tend to occur during off-peak business hours (night/early morning UTC), suggesting attackers target times with potentially reduced monitoring.
MVNO Prefixes Were Frequent Targets
One of the strongest signals across multiple campaigns was heavy concentration around specific mobile prefixes.
In France, the top 20 targeted prefixes accounted for significant fraud volumes:
Prefix | Blocked Count | Pattern |
+3365041 | 60,513 | SFR MVNO range |
+3366916 | 41,161 | SFR MVNO range |
+3365039 | 41,030 | SFR MVNO range |
+3366915 | 40,775 | SFR MVNO range |
+3366914 | 40,749 | SFR MVNO range |
+3374414 | 36,406 | Bouygues MVNO |
+3374417 | 36,307 | Bouygues MVNO |
+3374416 | 36,285 | Bouygues MVNO |
+3374415 | 35,931 | Bouygues MVNO |
Fraudsters target MVNO (Mobile Virtual Network Operator) number ranges, which often have less stringent fraud controls and revenue-sharing arrangements that enable IRSF.
How Companies Can Defend Against SMS Pumping
The most effective defenses in 2025 shared one common trait: they focused on disrupting attacker economics.
Attackers do not need perfect success rates. They only need campaigns to remain profitable.
Once profitability disappears, infrastructure shifts elsewhere.
1. Implement Prefix-Based Rate Limiting
Rate limit authentication requests based on phone number prefixes (first 6-8 digits), not just individual numbers.
Most organizations rate limit by individual phone number, which is insufficient.
Attackers rotate numbers rapidly while concentrating on the same carrier ranges.
The better approach is to monitor the first 6-8 digits to detect unusual prefix concentration so that when thresholds spike, entire ranges can be temporarily suppressed.
Example Rule:
- If prefix +3378247 receives > 50 requests in 10 minutes
- Then block all requests to that prefix for 1 hour
2. Monitor Carrier Volume Anomalies
Set up alerts for unusual spikes in traffic to specific MCC-MNC combinations:
Establish baseline volumes per carrier per customer
Alert when volume exceeds 3x baseline
Automatically throttle when volume exceeds 5x baseline
3. Implement Geographic Controls
Many organizations enable global SMS verification despite operating in limited regions, which creates an unnecessary attack surface.
The safer approach would be to enable only countries with real users while requiring additional verification for high-risk regions (or blocking them altogether).
4. Use Device and Behavioral Signals
Phone numbers alone are weak identity signals.
Layer additional signals beyond phone number validation to combine it with:
Device fingerprinting (JA4 fingerprints)
IP reputation scoring
User behavior analysis (request velocity, timing patterns)
Browser/app attestation
5. Design Authentication Flows with Abuse Resistance
Build fraud resistance into your authentication flows:
Don’t auto-send SMS: Require user action before triggering SMS
Implement CAPTCHA: Add human verification before SMS send
Use alternative channels: Consider WhatsApp, RCS, or app-based verification
Implement step-up verification: For suspicious requests, require email verification first
6. Real-Time Monitoring Dashboard
Make you have access to real-time data to effectively detect and combat fraud when it arises.
Here are essential metrics to track:
Requests per country per hour
Requests per carrier per hour
Prefix concentration metrics
Conversion rate by country (low conversion = potential fraud)
Cost per authentication by country
Key Learnings from 2025
Residential Proxies Became the Default Attack Infrastructure
In 2025, residential proxy networks emerged as the primary enabler of large-scale SMS pumping.
Their cost has dropped dramatically, their availability has expanded, and their legitimacy makes them difficult to distinguish from real users. This same infrastructure is increasingly used for web scraping and LLM data collection, further accelerating its commoditization.
This trend is expected to continue.
Breaking the Attacker’s Incentive Model
Attackers operate with a strictly economic mindset. SMS pumping campaigns are launched, scaled, and abandoned based on profitability alone. As soon as an attack becomes inefficient due to throttling, increased friction, lower delivery success, or higher operational cost, it is no longer worth sustaining.
When margins disappear, attackers do not try to adapt indefinitely. They simply redirect their infrastructure toward a new, less protected target.
This dynamic explains why many SMS pumping incidents appear as intense but short lived spikes. Organizations that react quickly and disrupt attacker economics are rarely attacked twice. Those that do not often become repeat targets or become the next one.
Your Authentication System Is Probably Under Attack
SMS pumping fraud has evolved into a mature, industrialized fraud ecosystem operating at global scale.
The findings from 2025 indicate that attackers are highly adaptive, economically driven, and increasingly sophisticated in how they exploit authentication infrastructure. They understand carrier routing, monetize telecom incentives, leverage residential proxy networks, and optimize campaigns around operational blind spots.
Most importantly, they exploit a fundamental assumption many organizations still make: that authentication traffic is inherently legitimate.
Across the 205 million authentication requests analyzed in this report, nearly 12% were fraudulent. In some countries, fraud represented the overwhelming majority of all authentication activity. Much of it blended seamlessly into normal product metrics, inflating DAU, onboarding volume, and geographic growth signals while quietly generating significant SMS costs.
The future of authentication defense will depend on real-time intelligence, adaptive risk systems, and a deeper understanding of attacker economics.
Because modern SMS pumping attacks are not designed to break authentication systems.
They are designed to quietly profit from them.
Modern authentication platforms must therefore treat fraud prevention as a core infrastructure layer, not an optional add-on. Systems like Prelude include built-in anti-fraud infrastructure designed to detect and stop these attacks in real time by analyzing dozens of behavioral, device, network, and telecom signals before fraudulent verification requests ever reach carrier networks.
Start optimizing your auth flow
Send verification text-messages anywhere in the world with the best price, the best deliverability and no spam.


Solutions